‣ Grafana
![]()
Overview
Grafana is a multi-platform open source analytics and interactive visualization web application. It provides charts, graphs, and alerts for the web when connected to supported data sources. A licensed Grafana Enterprise version with additional capabilities is also available as a self-hosted installation or an account on the Grafana Labs cloud service. It is expandable through a plug-in system. End users can create complex dashboards using interactive query builders.
Community-developed Cassandra Datasource for Grafana supports both Apache Cassandra as well as DataStax AstraDB, allowing to use Cassandra as a data backend for Grafana. Data can be pulled using simple Query Configurator or more advanced but powerful Query Editor.
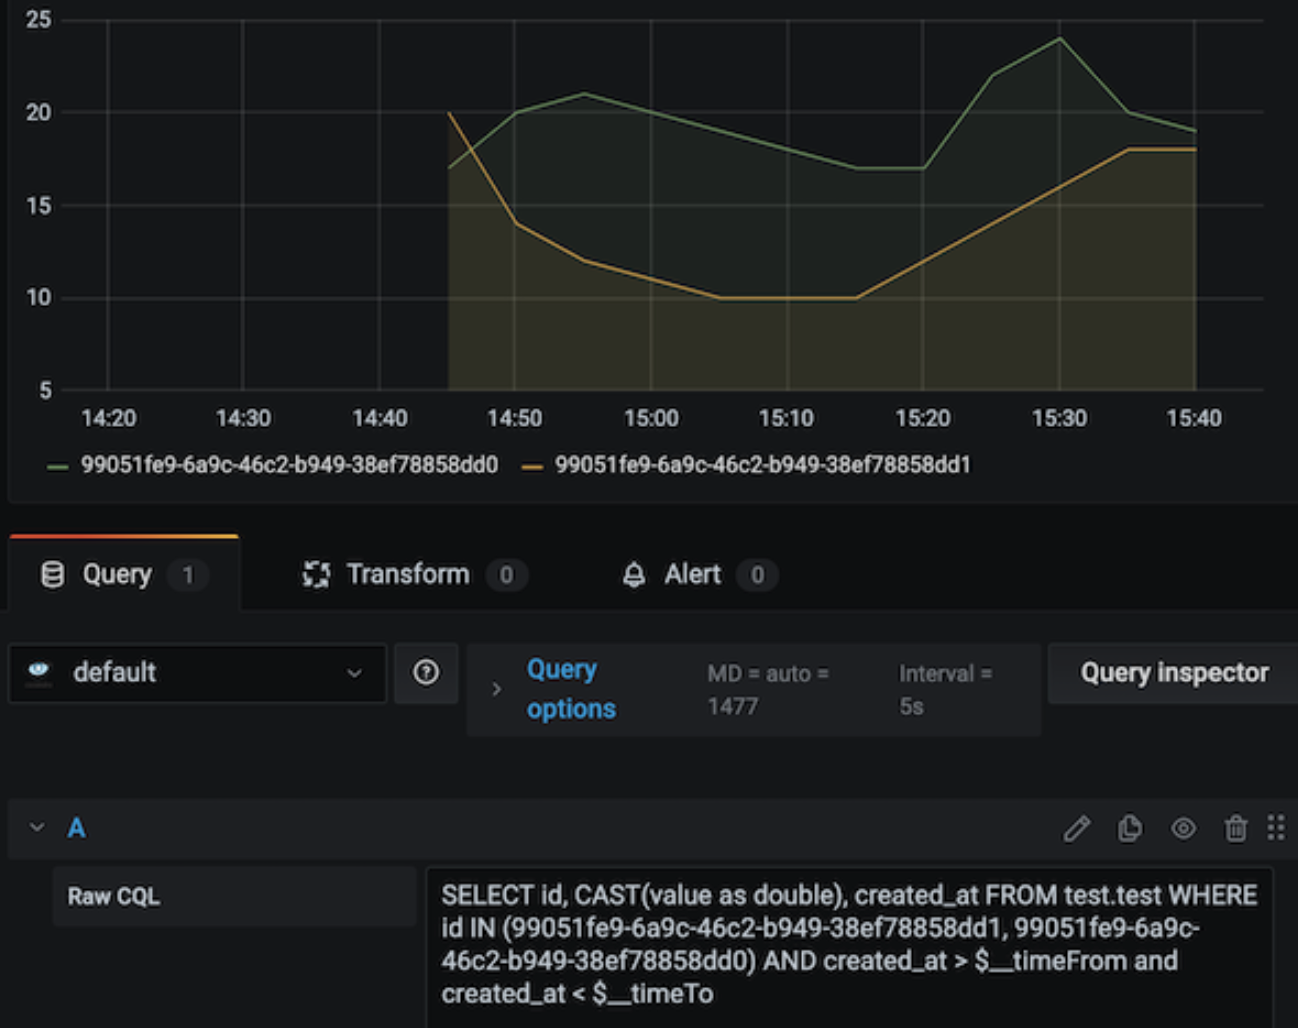
(On the picture: Query Editor at work)
Prerequisites
- To use Grafana, you will need a running Grafana instance deployed locally or in a cloud. Locally launched Grafana in Docker works well too.
- You should have an Astra account
- You should Create an Astra Database
- You should Have an Astra Token
- You should Download your Secure Connect Bundle and unpack it.
Keep the token information and the bundle file location ready: these will be soon provided in the datasource configuration.
Quickstart
Install the plugin using CLI or using web-interface
- Install the plugin using grafana console tool:
It will be installed into your grafana plugins directory; the default is /var/lib/grafana/plugins. Alternatively, enable it using Grafana Web UI.
Create a Datasource
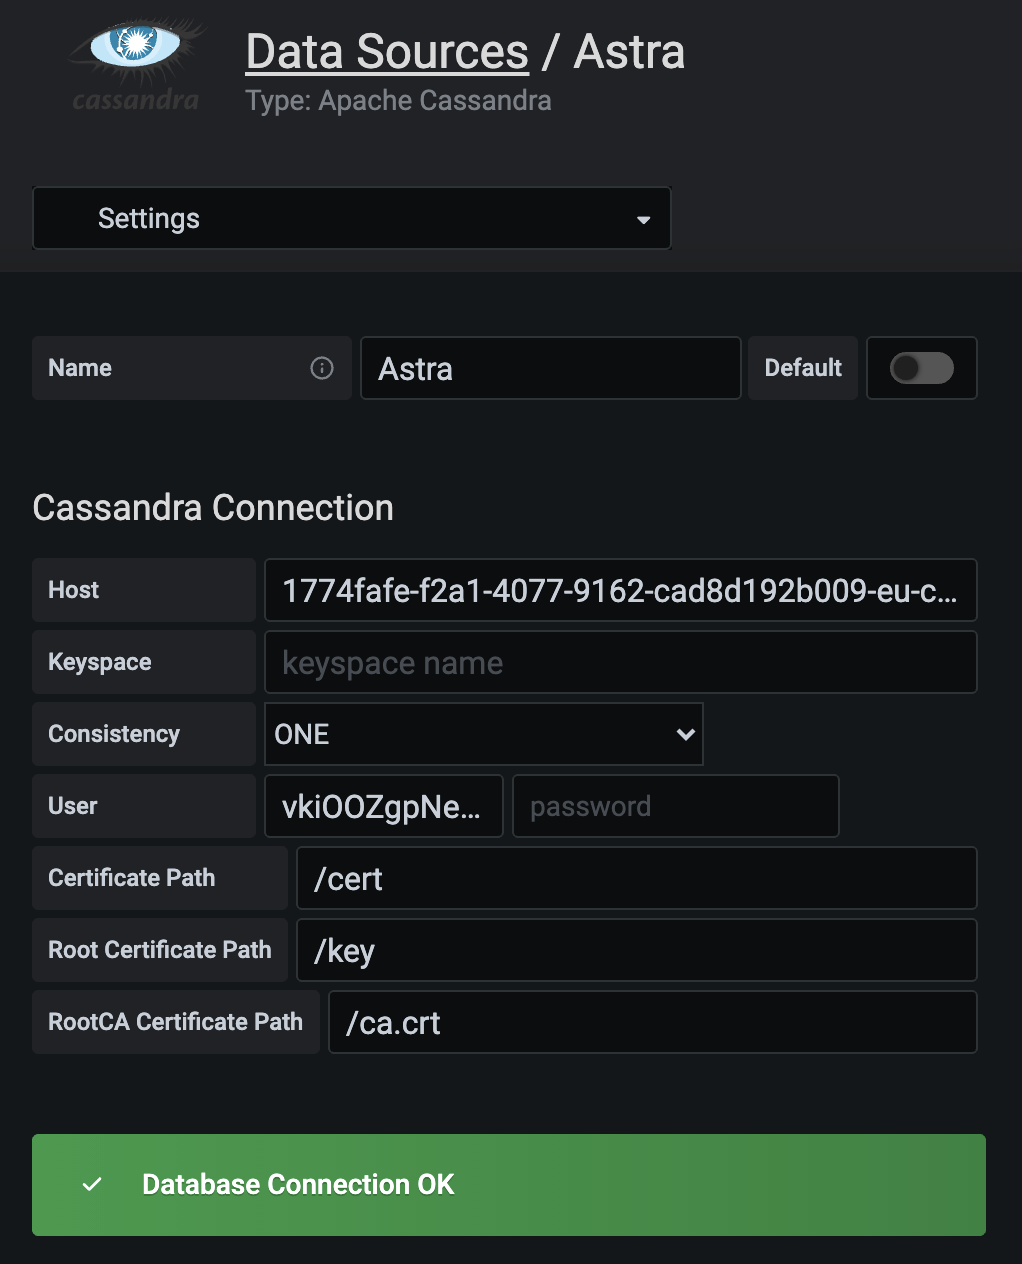
- Add the Apache Cassandra Data Source as a data source at the datasource configuration page.
-
Enable
Custom TLS Settingsbutton and configure the datasource using following details: -
Host: specify the
host:cql_portvalues from theconfig.jsonfile from the SecureConnectBundle. It should look like1234567890qwerty-eu-central-1.db.astra.datastax.com:29402IMPORTANT Notice, it has to be thecql_portvalue, not justport - User:
Client IDof the API Token - Password:
Client Secretof the API Token - Certificate Path:
/path/to/cert(usecertfile from SecureConnectBundle) - Root Certificate Path:
/path/to/key(usekeyfile from SecureConnectBundle) - RootCA Certificate Path:
/path/to/ca.crt(useca.crtfile from SecureConnectBundle)
Push the Save and Test button, if everything is right, you will see a Database Connection OK message.
If the database cannot be connected, check the following known common issues:
Known issues:
Misconfigured Port (Using port instead of cql-port)
Sometimes users specify the wrong port and a connection cannot be established. If you can't connect to your Astra instance, please check if the correct port specified in the datasource config (See step 3 above)
Unavailable TLS files
if you have an error message like [ERROR] cassandra-backend-datasource: Unable create tls config, open /cert: permission denied, it means that Grafana cannot open TLS certificate files. Set the proper permission f.e. using chown command. If you copied the files using docker cp command, they'll be copied by a root user and grafana will have no access to them.
Usage
First, to visualize the data, you have to create a panel. Choose or create a dashboard and create a panel. In the panel setup, choose the correct datasource from the previous steps.
There are two ways to query data from Cassandra: Query Configurator and Query Editor. Configurator is easier to use but has limited capabilities, Editor is more powerful but requires an understanding of CQL.
Query Configurator

Query Configurator is the easiest way to query data. At first, enter the keyspace and table name, then pick proper columns. If keyspace and table names are given correctly, the datasource will suggest the column names automatically.
- Time Column - the column storing the timestamp value, it's used to answer "when" question.
- Value Column - the column storing the value you'd like to show. It can be the
value,temperatureor whatever property you need. - ID Column - the column to uniquely identify the source of the data, e.g.
sensor_id,shop_id, or whatever allows you to identify the origin of data.
After that, you have to specify the ID Value, the particular ID of the data origin you want to show. You may need to enable "ALLOW FILTERING" although we recommend avoiding it.
Example Imagine you want to visualise reports of a temperature sensor installed in your smart home. Given the sensor reports its ID, time, location and temperature every minute, we create a table to store the data and put some values there:
CREATE TABLE IF NOT EXISTS temperature (
    sensor_id uuid,
    registered_at timestamp,
    temperature int,
    location text,
    PRIMARY KEY ((sensor_id), registered_at)
);

insert into temperature (sensor_id, registered_at, temperature, location) values (99051fe9-6a9c-46c2-b949-38ef78858dd0, '2020-04-01T11:21:59.001+0000', 18, 'kitchen');
insert into temperature (sensor_id, registered_at, temperature, location) values (99051fe9-6a9c-46c2-b949-38ef78858dd0, '2020-04-01T11:22:59.001+0000', 19, 'kitchen');
insert into temperature (sensor_id, registered_at, temperature, location) values (99051fe9-6a9c-46c2-b949-38ef78858dd0, '2020-04-01T11:23:59.001+0000', 20, 'kitchen');
In this case, we have to fill the configurator fields the following way to get the results:
- Keyspace - smarthome (keyspace name)
- Table - temperature (table name)
- Time Column - registered_at (occurence)
- Value Column - temperature (value to show)
- ID Column - sensor_id (ID of the data origin)
- ID Value - 99051fe9-6a9c-46c2-b949-38ef78858dd0 ID of the sensor
- ALLOW FILTERING - FALSE (not required, so we are happy to avoid)
In the case of a few origins (multiple sensors), you will need to add more rows. If your case is as simple as that, a query configurator will be a good choice, otherwise please proceed to the query editor.
Query Editor
Query Editor is a more powerful way to query data. To enable query editor, press the "toggle text edit mode" button.

Query Editor unlocks all possibilities of CQL including aggregations, etc.
SELECT sensor_id, CAST(temperature as double), registered_at FROM test.test WHERE id IN (99051fe9-6a9c-46c2-b949-38ef78858dd1, 99051fe9-6a9c-46c2-b949-38ef78858dd0) AND created_at > $__timeFrom and created_at < $__timeTo
- Follow the order of the SELECT expressions, it's important!
- Identifier - the first property in the SELECT expression must be the ID, something that uniquely identifies the data (e.g.
sensor_id) - Value - The second property must be the value that you are going to show
-
Timestamp - The third value must be a timestamp of the value. All other properties will be ignored
-
To filter data by time, use
$__timeFromand$__timeToplaceholders as in the example. The datasource will replace them with time values from the panel. Notice It's important to add the placeholders otherwise query will try to fetch data for the whole period of time. Don't try to specify the timeframe on your own, just put the placeholders. It's grafana's job to specify time limits.

Contacts
We hope it works well for you! In case of any questions please contact developers using GitHub Discussions.